For our analysis, we used the OMP’s observational dataset from 2002-2018. Within this dataset, categories are listed as mussel monitoring variables, however, collection methods were not exclusive to mussels and contain both oyster and mussel samples. Therefore, within this project we use mussels to refer to both oysters and mussels. We focused our analysis on water temperature (°C) and tunicate larvae density data (number of larvae/150L) as our predictor variables, with maximum mussel larvae size (MMLS) (μm), as our response variable. All variables are continuous. As mentioned previously, tunicate larvae monitoring began in 2007 after the risk of clubbed tunicate entering the Bideford river was discovered (Burleigh et al., 2010). Mussel larvae monitoring and spat collection began as early as 2002 (Burleigh et al., 2010). For our analysis we opted to combine all species of tunictae larvae detected into one generalized tunicate column. Due to the irregularity of the data collection, we had to clean the data table to remove unnecessary variables, as well as replace any empty cells with ‘NA’ for all variables in the table to be able to run our analysis. Additionally, we chose to only use maximum mussel larvae size as a measure of productivity, instead of using both mussel size and concentration, due to the lack of knowledge needed to complete the complex statistical analysis of mussel larvae concentration.
Mussel production is influenced by many factors including salinity levels, pollutant levels, erosion, over-fishing, and disease which are not accounted for within this study and should be kept in mind when reviewing the data and results (Office of Habitat Conservation, 2022).
Mussel production is influenced by many factors including salinity levels, pollutant levels, erosion, over-fishing, and disease which are not accounted for within this study and should be kept in mind when reviewing the data and results (Office of Habitat Conservation, 2022).
Data Table
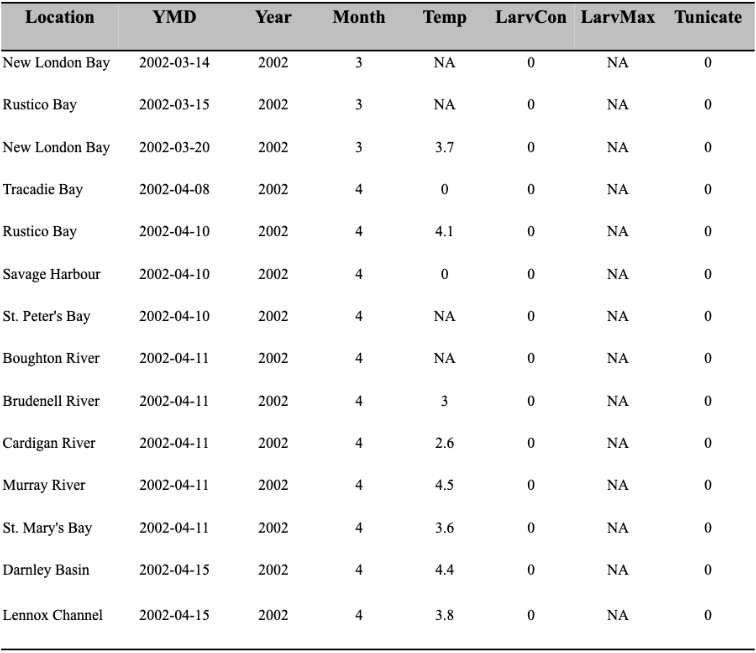
The first fourteen rows of our simplified data set is shown below (Table 1).
Table 1. Raw data table showing data collected by Oyster Monitoring Program from 2002-2018. Location is the sampling site that the data was collected for that year, month and day. YMD is the year, month, and day of data collection. Temp is the water temperature at collection sites in degrees Celsius. LarvMax is the Maximum Mussel Larvae Size (MMLS) in micrometers, and tunicate is the density of tunicate larvae counted per 150 litre.
Variables |
The independent sampling unit for our study was years, therefore there are 16 independent sample years from 2002 to 2018.
There were two predictor variables within this study. For the relationship between water temperature (°C) and MMLS (μm), the predictor variable is water temperature. It is measured continuously and was not manipulated. For the relationship between tunicate density (number/ 150L) and MMLS (μm) the predictor variable variable is tunicate density. It is continuous and was not manipulated.
There was one response variable analyzed in our study. The response variable was MMLS (μm) which was continuous and not manipulated.
Exploratory Graphs
We created a visualization of our data coverage from 2002-2018 in order to inspect the data for missing records, comparability between variables, and seasonality of data collection (Figure 3).
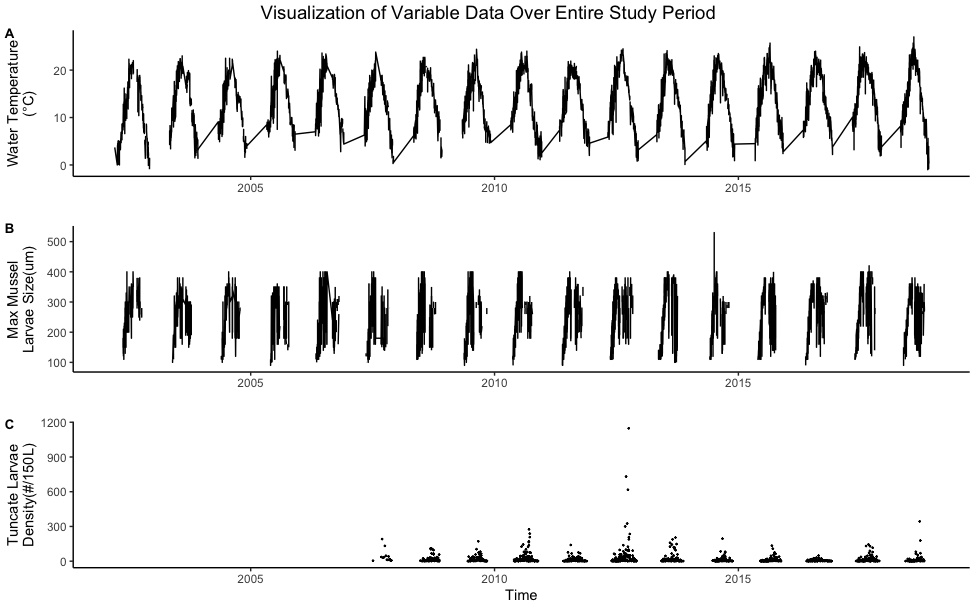
Figure 3: Graphs presenting the (A) water temperature data in degrees Celsius, (B) MMLS data in µm, and (C) tunicate larvae concentration data in number per 150L, over the time frame 2002* to 2018.
*For graph C records only began in 2007.
*For graph C records only began in 2007.
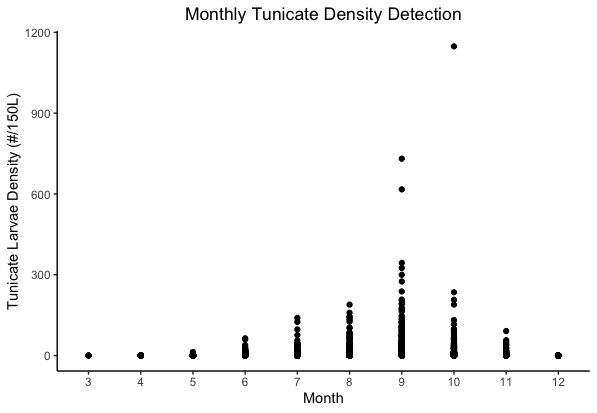
Figure 4: Visualization of spread of tunicate larvae detection, where tunicate larvae density records collected from 2007-2018 are plotted against time (months). Months in the x-axis correspond to calendar months.
|
Tunicate larvae density was collected in a non-regular periodical manner throughout each growing season from 2007-2018. As such, each month and year had a different number of records collected at different time periods (Figure 4). Because of this, we decided to take the monthly averages calculated from each month, and group them by year. We opted to leave in the outliers in the Tunicate Larvae Density records as they all occur within the same sampling location and year.
|
Disclaimer: When the term "mussels" is used throughout this website, it is referring to both mussels and oysters. This is due to the fact that the OMP collected oyster and mussel data but failed to differentiate between them when recording data.
