Study Area
Map of the Study Area for the Oyster Monitoring Program from 2002 to 2018.
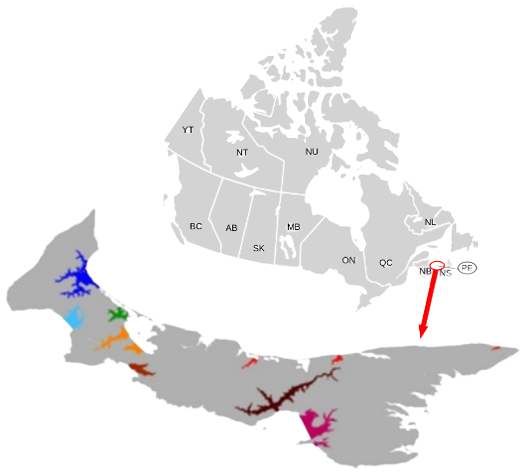

Figure 1: Map showing the areas sites were sampled from during OMP data collection from 2002-2018. There are 8 areas, however, we were unable to determine which and how many sampling sites occurred in each area as they differed each year. The sampling sites listed beside each Area are the sites where data was collected in 2022, with the exception of Area 5 that lists no sampling sites. The areas are color coded to the map of PEI (Department of Fisheries and Communities, 2022; Lokal_Profil, 2007; Prince Edward Island, n.d.).
The OMP data was collected on a provincial scale (Burleigh et al., 2012). Sampling sites were broken up into 8 areas within PEI as shown above (Figure 1), however, the sampling sites within each area changed every year the study was conducted (Burleigh et al., 2012; Burleigh et al., 2010). We were unable to determine which sites occurred in which areas based on the raw data presented by the OMP, therefore, location was not used as an independent sampling unit.
Data Collection
Data collection methods were outlined in Burleigh et al. (2010) and Burleigh et al. (2012) program reports. Annual reports were prepared for each years worth of data collected, however, only two reports, 2010 and 2012, were made available to the public. Therefore, these two reports were used to define how data was collected for the entire period of study.
Water temperature levels were collected periodically on the sampling days, however, some sites had loggers that collected hourly data (Burleigh et al., 2010). Before spawning is triggered by 20°C water temperatures, mussels gonads were monitored to ensure spawning wasn’t missed. After the release of eggs and sperm, from late June to mid August, water samples were collected 1-3 times per week (sometimes more frequently). This was done using a 63-micrometer net that was 2.5meters long towed from a boat at a consistent and low speed. The net retained larvae larger than 90 micrometers. The contents were then transferred to 1L beaker where a 1 mL sub-sample was taken and placed under a microscope to determine larvae size. The study also collected larvae spat fall which is a measurement of larvae that have attached to a substrate and therefore will remain immobile for the rest of their life cycle (DAFA, 2005). Sample sites deployed collection lines made of galvanized wire with scallop shells attached at 3 different lengths along the wire (Figure 2). Scallop shells were used as they are a great substrate for mussel attachment. Every 2-3 days 2 shells were switched out, with 1 shell being left on the wire for approximately 3 weeks. After the shells were taken off the wire, a dissecting microscope was used to count the mussel spat on the shells. This method gave short term and long term data for spat collection. Water sampling in some sites continued until late September in order to determine when spat fall was finished and inform fishermen on when to treat and/or kill spat fallen on older mussels in order to prevent reduced growth size. Finally, tunicate data was measured periodically by monitoring collection lines to determine tunicate densities. However, this did not start till 2007 with the increasing risk of clubbed tunicate in Bideford River.
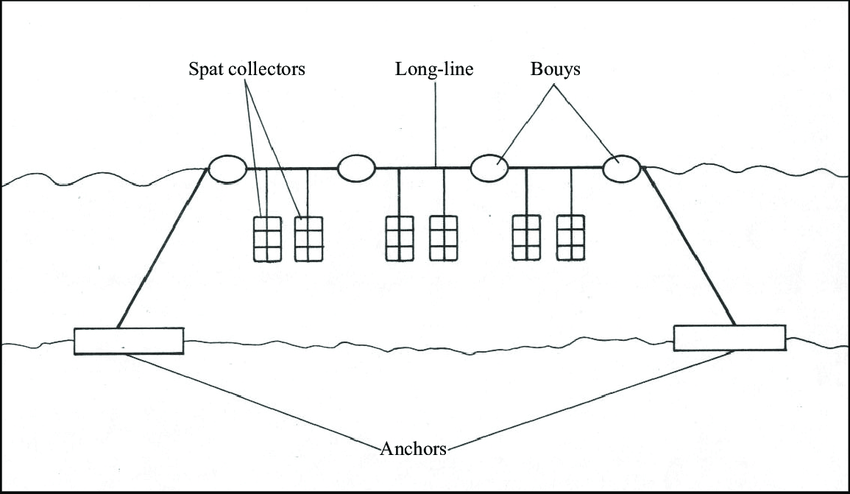
Figure 2: Image depicting mussel larvae collection lines from concentration data and tunciate density data* was collected from 2002-2018 (Tamatamah, 2011). Tunicate density data collection did not begin till 2007.
Picture citation: (Zoological Society of London, 2021)
Disclaimer: When the term "mussels" is used throughout this website, it is referring to both mussels and oysters. This is due to the fact that the OMP collected oyster and mussel data but failed to differentiate between them when recording data.
