Relationships Among Variables
First we looked at the annual trends of each of our variables (Water Temperature, Maximum Mussel Larvae Size (MMLS), and Tunicate Larvae Density). From the graphs we can see that the median trends for each do not seem correlated upon visual inspection (Figure 5). Even after the discovery of and initiation of tunicate larvae monitoring and detection, MMLS remains consistent despite spikes and dips in tunicate density. There is a slight increase in water temperature over the years which follows our expectations and most climate models. For the MMLS there is an increase in 2010, and there is also a very slight increase in tunicate larvae density in 2010. Based on the graphs, there is no corresponding increase in water temperature at this time to explain these trends. More statistical analysis is required to determine why these increases occurred, however, it could be caused by factors that were not measured such as salinity levels, pollution levels, erosion, etc. We can also see that after 2015 tunicate larvae density stays around zero but you can see an increase in MMLS. The increase in the MMLS is most likely due to reduced competition for food and a lower suffocation frequency by tunicates.
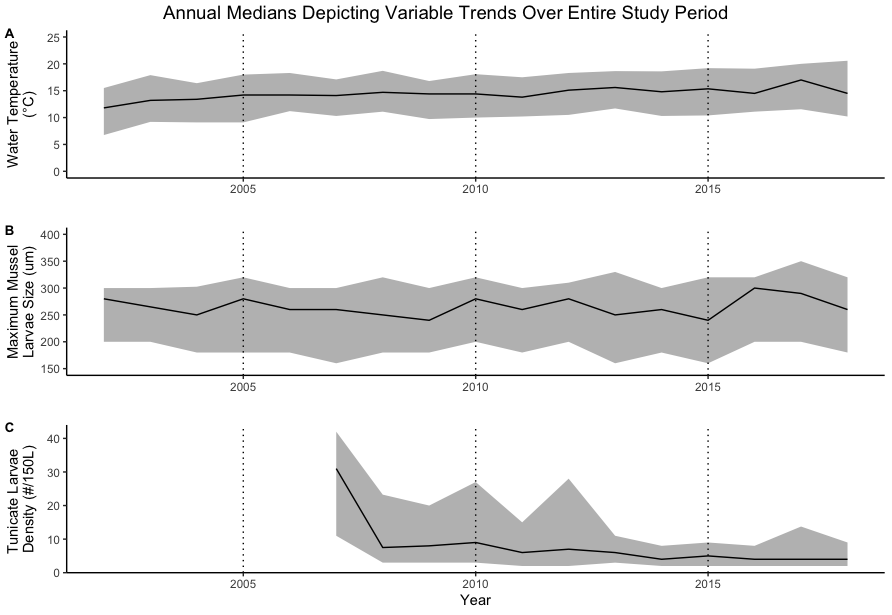
Figure 5: Graphs presenting the medians of (A) water temperature data in degree Celsius, (B) MMLS data in micrometers, and (C) tunicate larvae concentration data in number per 150L, over the time frame 2002* to 2018. The grey areas represent the 25th and 75th percentile ranges for each variable.
*For graph C records only began in 2007.
*For graph C records only began in 2007.
Monthly Average Trends
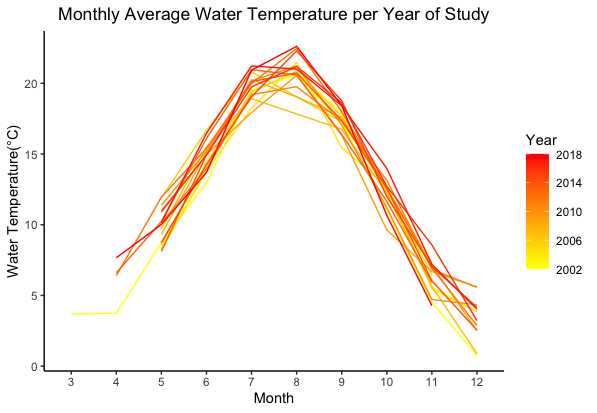
Figure 6: Relationship between average water temperature and time of year (divided by months). Each line represents average water temperatures across all sites from 2002 to 2018.
|
To visualize the spread and change in water temperature samples for each sampling year, we calculated the monthly average water temperature grouped by year, and plotted the averages in a bivariate coloured line graph against months, with each line depicting a yearly record in seasonal temperature averages (Figure 6). Some years contained water temperature records starting in March, while in others the temperature was not recorded until May. You can see from the graph that red lines tend to be higher than lighter coloured lines which indicates a trend of increasing temperatures. Additionally, you can see that temperatures are higher during the summer months, which is expected.
|
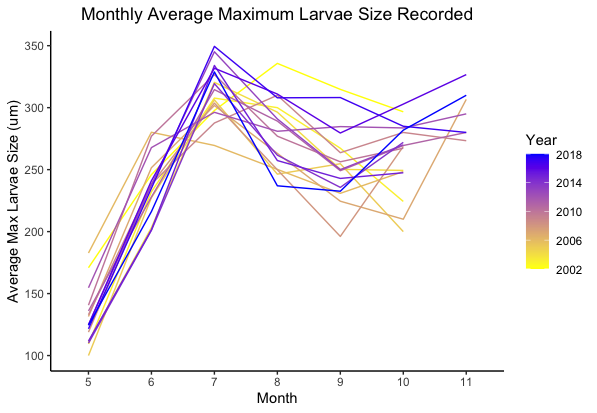
Figure 7: Relationship between average MMLS and time of year (divided by months). Each line represents the average MMLS across all sites grouped by year from 2002 to 2018. Month numbers correspond to calendar months.
|
Like Figure 6, in order to be able to visualize yearly coverage of data collection, MMLS records were averaged by month and grouped by year, and then plotted in a bivariate coloured line graph to depict yearly records of MMLS trends (Figure 7). Each line represents one sampling year or data records for 2002-2018.
We can see from the graph that there are no clear trends and that size looks stable over time. |
|
In Figure 8 we have a good visualization of when tunicate larvae density peaks in the growing season so that we can further interpret and analyze how that may affect mussel larvae growth and management decisions. Upon further inspection of the peak seen in Figure 8, we determined this occurred in the Boughton River in 2012. We decided to investigate the effects of this outbreak further, in a more localized manner to determine how the high tunicate densities impacted mussel productivity. |
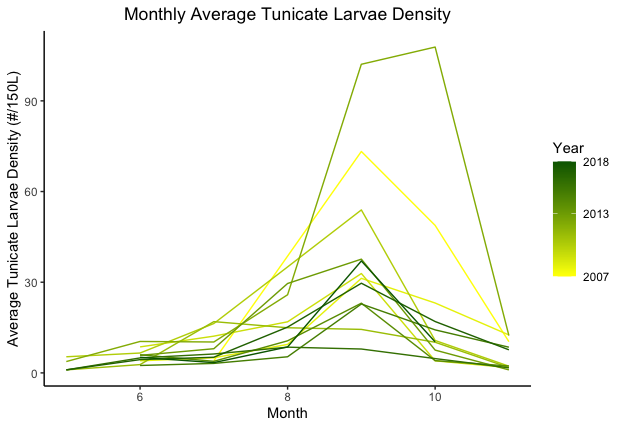
Figure 8: Relationship between the average tunicate larvae density (number of tunicate larvae/150L) and time of year (divided by months). Each line represents the average tunicate density across all sites for the years 2007 to 2018. Month numbers correspond to calendar months.
|
Tunicate Density and Mussel Larvae Comparision
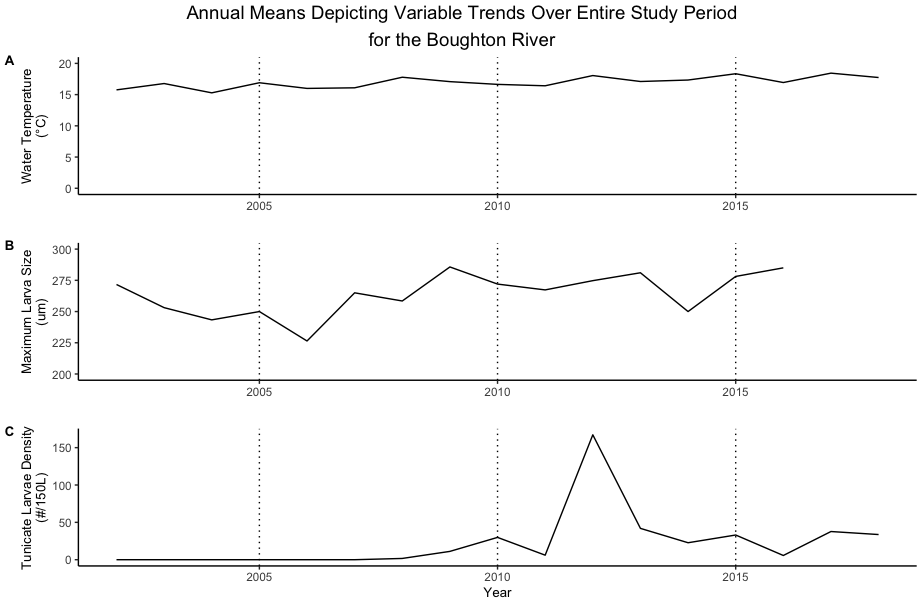
Figure 10: Graphs representing the mean of (A) water temperature in degrees Celsius, (B) mussel larvae concentration in micrometers, and (C) tunicate larvae density in number per 150 L over the time frame 2002* to 2018 for the Boughton River.
* For graph C, data collection began in 2007.
* For graph C, data collection began in 2007.
Because there was no drastic increases in tunicate densities in any other sampling areas over the course of the monitoring program, we delved deeper into the outbreak in the Boughton River in 2012 to determine if the drastically higher tunicate densities had an impact of MMLS within that growing season (Figure 10). Upon visual inspection, we can see that there was no corresponding dip in MMLS during the same growing season as the tunicate larvae density spike, however, we do see a significant decline in MMLS in the year or two following. Unfortunately due to a lack of information regarding surrounding environmental factors, we cannot determine whether this was due to the residual effects of the spike in tunicate density, or if other factors were influencing growth that season.
Tunicate Density and Water Temperature Comparison
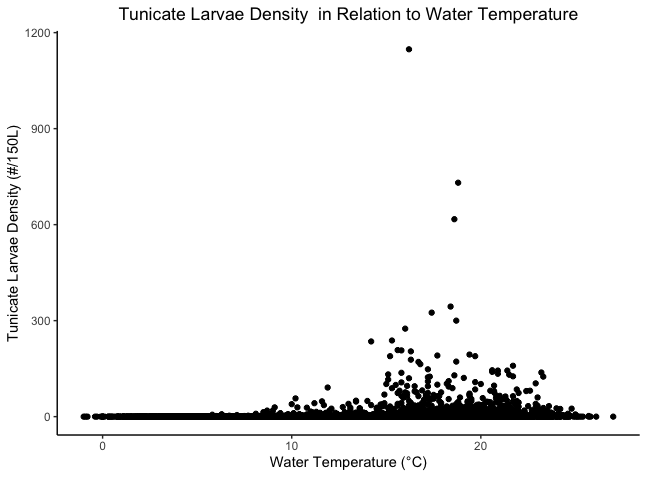
Figure 9. Relationship between tunicate larvae density (number of tunicate larvae/150L) and water temperature (°C).
When visually inspecting the distribution of tunicate larvae density records, we can see that density increases as water temperatures increases, and occur mostly within the range of approximately 8-25°C (Figure 9). The trend seen is expected as numerous studies have indicated that tunicate densities and productivity will increase with rising water temperatures (Lubofsky, 2022). The outliers in this graph all originate from the same sampling site within the same year (Boughton River, PEI, 2012), and were collected consecutively from September 12th to October 2nd.
Statistical Analysis
Upon the visual inspection of our data, we could not determine any significant relationship between our variables. We opted to preform a linear regression analysis since our independent predictor variables and response variables are continuous. Additionally, we completed a Pearson correlation coefficient test to determine the strength and direction of the relationship between our variables. Although our data does not follow normality, we chose to ignore the normality assumption in our linear regression analysis due to the central limit theorem and the large sample sizes we had. Additionally, we focused our analysis on MMLS rather than minimum mussel larvae size as mussels need to reach a certain size in order to be harvestable (DAFA, 2005). Therefore, it would be more important for PEI to determine if the mussels harvestable size is being influenced by water temperature and tunicate densities than it would be to provide information on general mussel size.
Table 2: Correlation Coefficients for water temperature, MMLS, and tunicate larvae density for 2012.
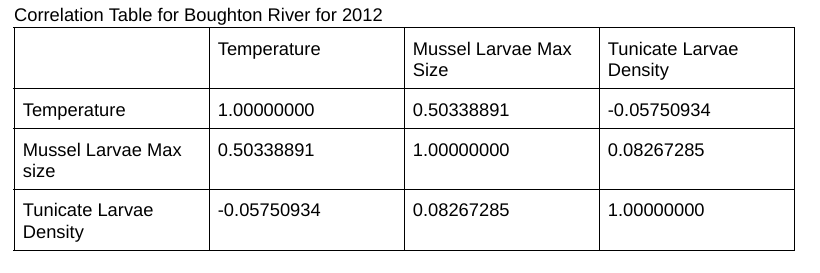
Table 2 shows the correlation coefficients for water temperature, MMLS, and tunicate larvae density for the Boughton River in 2012. These were calculated using the Pearson's correlation coefficient equation in R. We focused on the Boughton River in 2012 due to the observed outbreak identified in Figure 10. As you can see there is a positive correlation between MMLS and temperature, however, it is not a strong relationship. Additionally, the correlation between temperature and tunicate larvae density is negative and weak. This is unexpected based on a literature review that indicated tunicate density would increase with increasing temperatures. Additionally, we can see that while there is a positive relationship between tunicate larvae density and MMLS, it is a very weak relationship.
Table 3: Linear regression outputs for maximum mussel larvae size, water temperature, and tunicate density for the Boughton River in 2012.
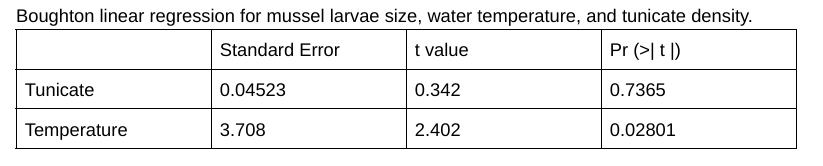
The outputs presented in Table 3 were achieved by completing a linear regression analysis in R between MMLS and temperature, and MMLS and tunicate density for the Boughton River in 2012. This was done in order to assess if localized effects of tunicate larvae density on MMLS exist. Based on our pre-determined alpha level of 0.05, we did not find a significant statistical relationship between tunicate larvae density and MMLS in this river in 2012 (P=0.7365). However, we can see that temperature does have an effect on MMLS in 2012 within this river (P=0.02801). Additionally, we can see from our t values that there is a higher likelihood of an effect relationship between temperature and MMLS since our t value is larger than zero (t=2.402). Furthermore, we can see that from our two standard error values, that our regression model is a good fit to the data (SE tunicate=0.04523; SE temperature= 3.708).
Table 4: Correlation Coefficients for water temperature, MMLS, and tunicate larvae density for 2002 to 2018.
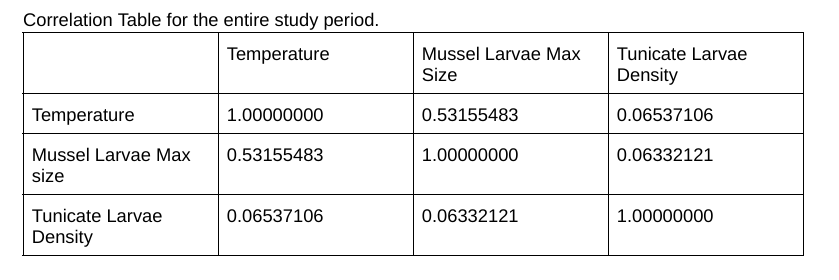
The values presented in Table 4 were achieved by completing correlation coefficient equations in R between MMLS, tunicate larvae density, and water temperature. As you can see, there is a positive correlation between all variables. However, the relationship between temperature and tunicate density is nearly non-existent since the correlation coefficient is close to zero. Additionally, the relationship between MMLS and tunicate density is weak. However, the relationship between MMLS and temperature has medium strength.
Discussion
Based on the trends we found during our initial exploration of the data, we did not find significant enough differences to make any strong conclusions about the effects between our chosen variables. As a result were were recommended and chose to focus more on the visual analysis of the trends of the effects that tunicate density and water temperature had on MMLS, as no statistical test could provide us with any significant or valid output. We chose to do a linear regression model just for the purposes of performing a statistical analysis for this project, however due to the nature of our data we cannot make any definitive conclusions based on the results.
The results gained by the Boughton River analysis are very interesting as we could not determine a statistically significant relationship between tunicate density and MMLS on the local level. Additionally, no rise in temperature was indicated at the same time as the spike in tunicate larvae density. From our linear regression analysis we can say that we are failing to reject the null and that we are 70% certain there is no effect between tunicate density and MMLS in the Boughton River in 2012. This is unexpected due to the literature review that indicated that rising water temperatures will cause a increase in tunicate densities which would negatively impact mussel productivity by limiting their growth (Carman et al., 2016). However, due to the lack of data collected on other contributing factors or environmental conditions in the Boughton River at this time, the tunciate spike may have been caused by other factors such as nutrient availability (LeBlanc et al., 2007). For example, in 2012 the Biofouling Monitoring for Aquatic Invasive Species survey in the Maritimes Region, determined Ciona intestinalis to be one of the most widely distributed invasive tunicate species (Sephton et al., 2017). This species was found in 81-94% of all stations and 71-93% of all sentinel locations (Sephton et al., 2017). According to the AIS, this species was more likely to be found in areas that were warmer and more sheltered (Septhon et al., 2017). Although we did not see the warmer trend in the Boughton River it may have been sheltered enough to attract Ciona intestinalis and cause the spike we see in our data (Figure 10). Furthermore, we can see a decrease in MMLS one or two years after this spike which may indicate a delay in the effects of tunicate densities on MMLS. However, this loss in mussel larvae size may have been caused by other contributing factors not measured such as pollution levels, erosion etc. Further research would be required to determine if there is a lag time in measuring the effect of tunicate densities on MMLS or if this loss in size was caused by other environmental factors.
Overall, there did not appear to be an effect relationship with tunicate density and MMLS. Upon visual inspection, no trends could be found. Additionally, the correlation coefficients indicate a positive but near non-existent relationship between the two variables (Table 4). Therefore, based on our analysis we conclude that no significant effect of tunicate densities on MMLS could be found in PEI from 2002-2018, since there are no overall trends or significant statistical results to indicate an effect relationship.
Furthermore, while we can see a trend of warming in water temperatures over the years which is consistent with climate models, there does not appear to be a significant relationship between MMLS and water temperature in PEI from 2002 to 2018 based on our analysis. We can see from the Pearson correlation coefficient test that there is a positive and medium strength relationship between the two variables in both the overall study region and the Boughton River. (Table 2; Table 4) However, this does not indicate a strong relationship. We do see a statistically significant result in the linear regression in Boughton River between water temperature and MMLS (Table 3), which may indicate an effect relationship on the local level, however, no visual trend can be seen and other contributing factors were not analyzed, therefore, we cannot confidently conclude that there is an effect relationship between these two variables. There also does not appear to be an effect relationship between water temperature and tunicate larvae density based on our visual analysis and correlation tests. Although there is a positive correlation between these two variables it is very weak. Additionally, the Boughton River correlation test showed a negatively weak correlation. These results go against our predictions based on our literature review which indicated rising water temperatures would cause rising MMLS and rising tunicate densities, however, there may not have been enough temperature data to really indicate if these relationships exist. We recommend utilizing data from further back in time to provide a longer time scale and indicate if a significant relationship does occur. Although we cannot confidently conclude an effect relationship between water temperature and tunicate density and water temperature and MMLS exists in PEI from 2002 and 2018 we can see from our visual analysis a warming trend that follows most climate models. This knowledge combined with expectations from our literature review, means we can expect that as climate change progresses, the strength of these relationships will grow which may result in statistically significant relationships between these variables in the future. Further research would be required to ascertain if this relationship will exist.
Our results, while not what we predicted are still useful in understanding what influences mussel productivity in PEI. Mussel production is incredibly important to PEI as it provides numerous jobs, provincial revenue, ecosystem stability, and biodiversity (Connecticut Department of Agriculture, 2022; DAFA, 2005; Office of Habitat Conservation, 2022). Therefore, by understanding what does or does not impact their productivity on a local scale is essential. Our study utilized mussel size as a function of productivity since it influences population mortality and reproduction which affects productivity (Lowe et al., 2017). Upon completion of our analysis we can determine that no statistically significant relationship was found between water temperature, tunicate larvae density, and MMLS due to limitations in study design and data collection. Unfortunately, we cannot comment on the sustainability of mussel harvesting within PEI as we do not have frequency or harvesting data. Therefore, we cannot recommend any changes to PEI's management of mussels aside from suggesting that further studies are completed due to the limitations of this study. For example, it is recommended to complete an experimentally designed studied in order to provide more accurate data that can better assess these relationships. Additionally, continuous monitoring of temperature data should occur to provide long term data that can be used to predict if climate change will affect mussel productivity. Finally, frequency of harvesting data should be collected and analyzed against mussel productivity to determine if current management, combined with environmental factors like tunicate larvae densities and water temperature, is sustainable.
Conclusion
Climate models predict global rising ocean temperatures, and as seen by the slight temperature increase in the above graph, we can expect this trend to continue in PEI. By visually analyzing our data we can see that there is already a slow increasing trend in annual water temperatures in the PEI area. Unfortunately, tunicates have been identified as having higher productivity in warmer water temperatures than mussels, which means that there is a possibility that warming temperatures will exacerbate the negative impact they have on mussel productivity (Daigle & Harbinger, 2009). From our analysis of the OMP's mussel monitoring data, we were not able to make any determinations regarding the effects of tunicate density within the PEI area on mussel productivity, nor were the increases in annual temperatures drastic enough to show any effect on productivity. Our findings do not disprove the hypothesis that increases in these variables negatively impact mussel productivity, but rather reinforce that more research is needed to determine the thresholds of change required to initiate the declines in productivity. Climate change is an ongoing threat to marine and aquatic life, and understanding the level of change required before negative impacts are seen is vital to advising how quick action is needed in order to prevent severe and irreparable damage to these sensitive systems. Due to the inconclusive findings of our results, we cannot advise any changes to management at this time.
Picture citation: (Pouvreau, 2017)
Disclaimer: When the term "mussels" is used throughout this website, it is referring to both mussels and oysters. This is due to the fact that the OMP collected oyster and mussel data but failed to differentiate between them when recording data.
